ROAS (return on ad spend) is the most searched performance metric in European affiliate marketing, and for good reason. It answers a simple question: for every euro you spend, how much revenue comes back? In affiliate marketing, ROAS is calculated by dividing the revenue generated through affiliate partners by the total cost of your affiliate programme.

ROAS definition: Return on ad spend is the ratio of revenue attributed to a marketing channel divided by the cost of that channel. A ROAS of 8:1 means eight euros of revenue for every one euro spent.
The ROAS Formula
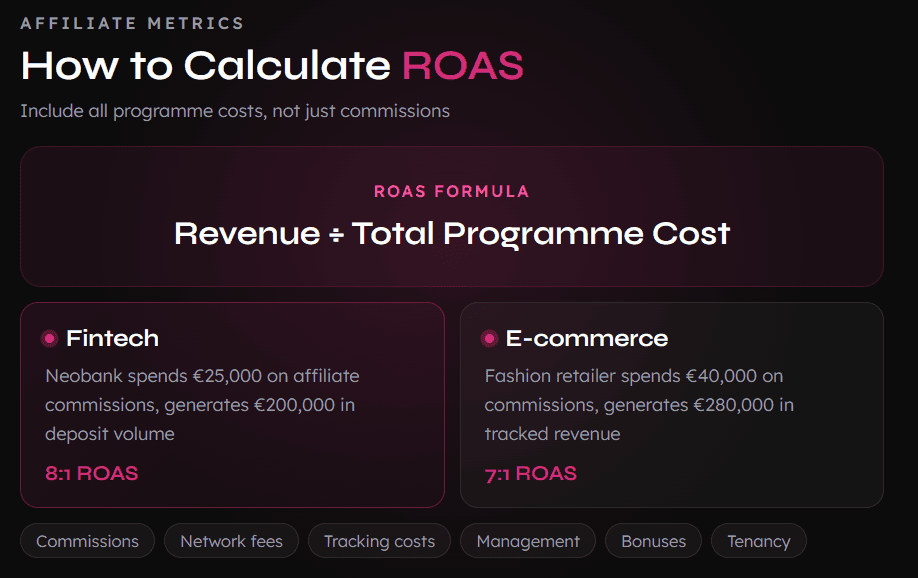
The formula itself is straightforward:
ROAS = Revenue from channel / Cost of channel
A neobank spends EUR 25,000 on affiliate commissions in Q3 and attributes EUR 200,000 in deposit volume to those affiliates. The ROAS calculation:
EUR 200,000 / EUR 25,000 = 8.0
That is an 8:1 ROAS, or 800%.
An e-commerce fashion retailer spends EUR 40,000 on affiliate commissions and generates EUR 280,000 in tracked revenue:
EUR 280,000 / EUR 40,000 = 7.0
Both numbers look strong. Both are potentially misleading. The answer depends entirely on what you count as “cost” and what you count as “revenue”, and this is where most affiliate managers get the calculation wrong.
What Counts as Revenue
Use the gross revenue attributed to the affiliate channel after returns and cancellations. If your neobank pays on funded accounts, count only the deposit values that actually cleared, not pending sign-ups. For e-commerce, strip out returned orders. Inflated top-line numbers produce a ROAS figure that looks good in a dashboard and falls apart in a board meeting.
What Counts as Cost
This is where affiliate ROAS diverges from paid media ROAS. In Google Ads, the cost is your ad spend. In affiliate marketing, cost is distributed across several line items:
- Commissions paid to publishers (CPA, CPL, or hybrid structures)
- Network or platform fees (typically 20-30% override on commissions)
- Tracking platform costs if you run on a SaaS platform
- Agency fees or in-house programme management salaries
- Publisher bonuses, performance incentives, and tenancy placements
- Content production fees paid to publishers as part of hybrid (CPL + CPS) arrangements
Most teams calculate ROAS on commissions alone. That understates true cost by 30-50% and produces a number that cannot be compared to any other channel.
How ROAS Relates to CPA, CAC and ROI
ROAS sits alongside several other performance metrics that are easy to confuse. Before going further, a quick comparison.
| Metric | What it measures | Formula | Best used for |
| ROAS | Revenue per unit of ad spend | Revenue / Ad spend | Channel efficiency comparison |
| CPA | Cost to acquire one converting action | Total spend / Number of conversions | Setting commission rates, budgeting |
| CAC | Full cost to acquire a customer | All acquisition costs / New customers | Business-level unit economics |
| ROI | Net profit relative to investment | (Profit – Cost) / Cost | Overall programme profitability |
CPA is the metric most affiliate programmes actually optimise around. If you want a deeper treatment of how CPA works in affiliate programmes, including how to set and negotiate rates, the Circlewise guide on cost per acquisition in affiliate marketing covers this thoroughly.
CAC includes every cost involved in acquiring a customer, not just affiliate spend. Sales team salaries, onboarding costs, product trials. ROAS only sees the channel cost.
ROI accounts for profit margins. ROAS does not. A programme with 10:1 ROAS on a product with 8% net margin is barely breaking even. A programme with 3:1 ROAS on a product with 60% margin is printing money. This is the single biggest reason ROAS fails as a standalone KPI, and we will return to it.
Calculating ROAS in an Affiliate Programme
Generic ROAS content treats the metric as if the advertiser is buying clicks. Affiliate economics are different in ways that matter for the calculation.
Commissions are post-conversion costs. In paid search, you pay for the click whether it converts or not. In affiliate, you pay after the conversion happens. This means affiliate ROAS almost always looks better than paid media ROAS. A programme manager who presents a 10:1 affiliate ROAS next to a 3:1 paid search ROAS and calls the affiliate channel “three times more efficient” is making an apples-to-oranges comparison. Paid search absorbed the cost of non-converting traffic. Affiliate did not.
Network fees are invisible spend. If you pay EUR 100 in commissions and your network charges a 25% override, your actual spend is EUR 125. Leaving out the override flatters your ROAS by 20%.
Tenancy fees and bonuses distort short-term numbers. A EUR 5,000 placement fee paid to a cashback publisher in January generates conversions across Q1 and Q2. If you calculate monthly ROAS, January looks terrible and March looks brilliant. Neither is accurate.
In-house cost is real cost. Two full-time affiliate managers at EUR 55,000 each plus a tracking platform at EUR 2,000 per month add EUR 134,000 to your annual denominator. That alone can cut a headline 12:1 ROAS down to 6:1.
A thorough framework for measuring affiliate marketing performance, including how attribution affects every metric discussed here, is covered in Circlewise’s guide on how to measure affiliate marketing performance.
ROAS Benchmarks by Vertical
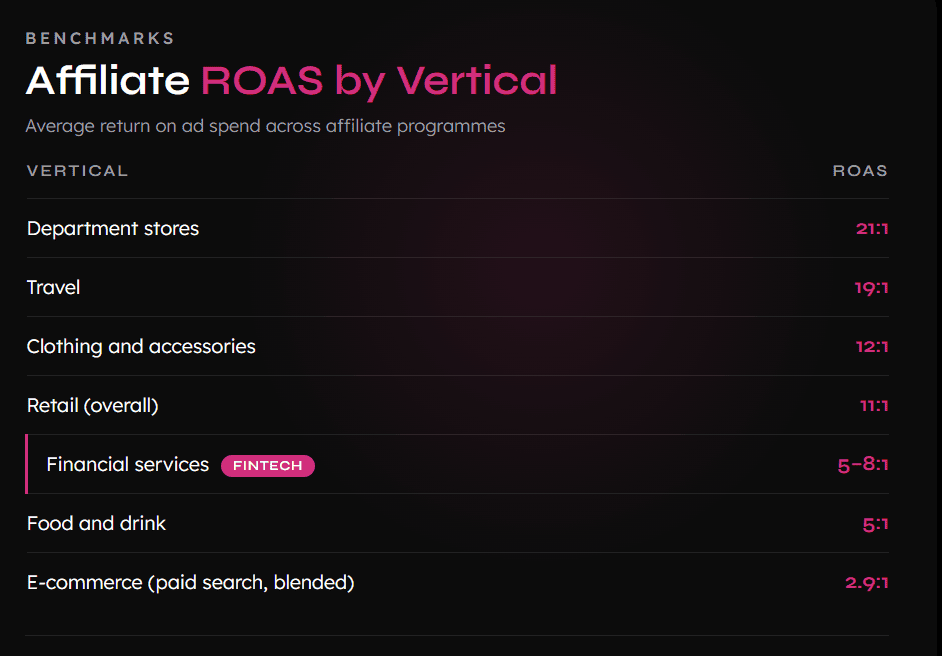
Benchmarks are useful as orientation. They are unreliable as targets, because every company defines the numerator and denominator slightly differently.
The PMA Industry Study 2025, compiled from data provided by eight affiliate networks and managed by London Research, provides the most widely referenced figures. The study covers U.S. data, but the ratios translate directionally to European markets. European-specific benchmarking data remains fragmented, which is itself a problem worth noting.
| Vertical | Affiliate ROAS (approximate) | Source |
| Travel | 19:1 | PMA Industry Study 2025 |
| Retail (department stores) | 21:1 | PMA Industry Study 2025 |
| Retail (clothing and accessories) | 12:1 | PMA Industry Study 2025 |
| Retail (overall) | 11:1 | PMA Industry Study 2025 |
| Financial services | 5:1 to 8:1 | PMA Industry Study 2025; Advertise Purple (2026) |
| Food and drink | 5:1 | PMA Industry Study 2025 |
| E-commerce (Google Ads, blended) | 2.87:1 | WebFX / Foundry CRO (2025-2026) |
A few things are worth highlighting. Travel’s 19:1 figure is driven by high average order values and planning cycles that involve multiple touchpoints, meaning the affiliate that gets the last click captures disproportionate credit. Financial services ROAS looks moderate on a per-transaction basis, but lifetime value per customer is significantly higher than in retail. If your fintech programme shows a 5:1 ROAS and your CFO asks why it is not matching retail benchmarks, the answer is that a EUR 40 commission on a trading account that generates EUR 3,000 in lifetime revenue is a different equation than a EUR 8 commission on a EUR 95 clothing order.
Cross-company comparison is weak for another reason: the definition of “spend” varies. Some programmes include only commissions. Others include network fees. Almost none include programme management salaries. Until the industry standardises the denominator, treat these figures as directional.
Why ROAS Should Not Run Your Programme
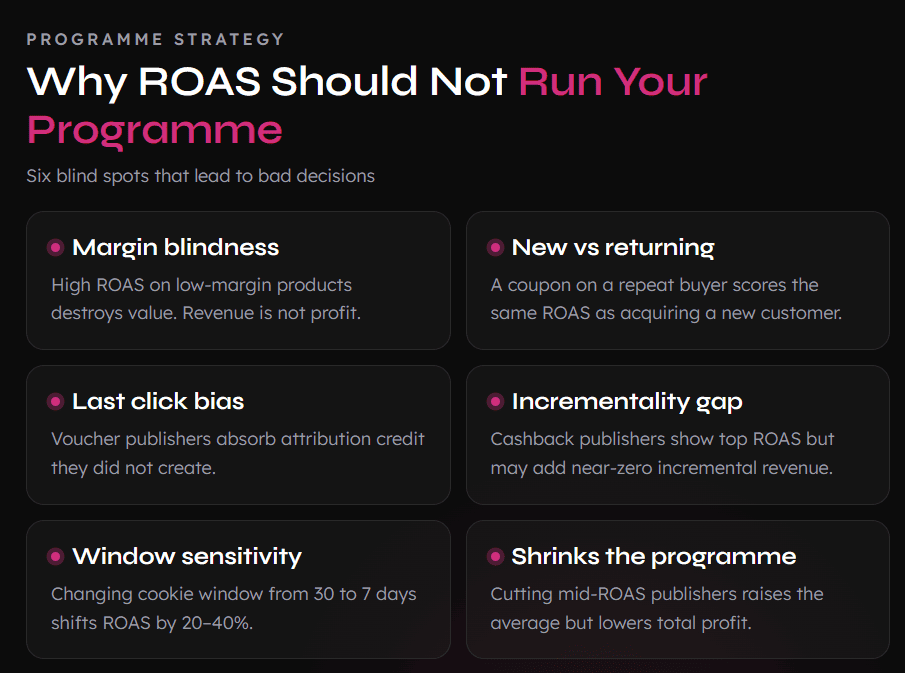
This is the core argument, and it applies whether you run a fintech programme paying CPL on loan applications or an e-commerce programme paying CPA on completed orders.
Margin Blindness
ROAS measures revenue, not profit. A fashion retailer with a 12:1 ROAS on clearance items at 15% gross margin generates less absolute profit than a 6:1 ROAS on full-price items at 55% margin. Optimising for ROAS pushes the programme toward high-revenue, low-margin conversions. In fintech, this shows up when a neobank’s affiliate programme drives high volumes of basic account sign-ups (low lifetime value) while underinvesting in premium account referrals because the ROAS looks worse on a per-conversion basis.
New Versus Returning Customers Treated Identically
A coupon publisher driving a returning customer to complete a purchase they would have made anyway generates the same ROAS as a content publisher introducing a brand-new customer. The economic value of those two conversions is wildly different. ROAS cannot tell them apart.
Last Click Bias
Most affiliate programmes still run on last-click attribution. A customer reads three comparison articles, clicks a paid ad, visits the site twice, then uses a voucher code at checkout. The affiliate who provided the voucher code receives 100% of the attribution credit. The ROAS for that publisher looks excellent. But that publisher did not create the demand. This is not an argument against voucher publishers. It is an argument against using ROAS to evaluate them as if they were content publishers doing top-of-funnel work.
For a deeper look at how attribution models interact with affiliate performance metrics, the Circlewise affiliate marketing glossary covers the relevant terminology.
Incrementality
The hardest question in affiliate marketing: would this conversion have happened without the affiliate? Cashback and loyalty publishers often intercept customers who are already in the checkout flow. The ROAS on those publishers is typically the highest in the programme. But the incremental revenue they generate may be close to zero. Cutting them might not reduce conversions at all. Or it might reduce conversions significantly, because some customers specifically seek out cashback. You cannot know from ROAS alone.
Attribution Window Sensitivity
Change the cookie window from 30 days to 7 days and watch your ROAS shift by 20-40%. The underlying business reality did not change. Only the measurement window moved. Any KPI that swings this much based on a tracking parameter setting is too fragile to drive investment decisions.
Optimising for ROAS Shrinks the Programme
This is the most common mistake, and experienced programme managers have all seen it happen. A team decides to cut every publisher with ROAS below 6:1. The average ROAS rises to 9:1. The head of growth celebrates. But total revenue dropped by 25%, because the mid-ROAS publishers were generating profitable volume that the top publishers cannot replace. Raising the ROAS floor concentrates the programme into fewer partners, increases dependency on a handful of cashback and voucher sites, and reduces the programme’s ability to reach new audiences.
Where ROAS Genuinely Works
ROAS is the right metric when you need to compare the efficiency of one channel against another at a high level, as long as the cost definitions are aligned. It works for quick reporting to senior stakeholders who need a single ratio. And it is useful as a guardrail: if ROAS drops below a threshold that indicates negative contribution, something needs investigation. The mistake is not tracking ROAS. The mistake is treating it as the primary lever for programme decisions.
What to Use Alongside ROAS
No single metric replaces ROAS. The point is to build a small dashboard of metrics that cover the blind spots:
- CAC (customer acquisition cost): total programme cost divided by new customers acquired, not total conversions
- LTV:CAC ratio: lifetime value of the customer relative to the cost of acquiring them; anything above 3:1 is generally healthy for fintech
- Contribution margin after commission: revenue minus COGS minus affiliate commission per conversion; tells you whether each conversion is actually profitable
- New customer share: percentage of affiliate-driven conversions that are genuinely new customers, not returning
- Incrementality testing: holdout tests, geo-matched experiments, or publisher-level pause tests to measure true lift
Keep the dashboard to five or six metrics. More than that and nobody reads it.
How to Set a ROAS Target
Do not start from a benchmark. Start from your own unit economics and work backwards.
Step 1: Determine your gross margin on the product or service the affiliate programme promotes.
Step 2: Decide what contribution margin you need after commission. This is the profit you require per conversion after paying the affiliate and covering variable costs.
Step 3: Calculate the maximum you can spend per euro of revenue while still hitting that margin.
Step 4: The reciprocal of that figure is your minimum ROAS.
Fintech Worked Example
A digital lending platform in Germany pays affiliates on a CPL basis. Average revenue per funded loan: EUR 1,200. Gross margin: 35% (EUR 420). The business requires at least EUR 200 contribution per loan after acquisition costs. That leaves EUR 220 available for total affiliate cost (commission + network fees + management overhead). Maximum cost ratio: EUR 220 / EUR 1,200 = 0.183. Minimum ROAS: 1 / 0.183 = 5.5:1.
Any publisher consistently below 5.5:1 on a fully loaded cost basis is destroying value. Any publisher above it is contributing profit. The target is not “as high as possible.” It is 5.5:1, and above that, the priority shifts to volume.
E-Commerce Worked Example
A DTC beauty brand selling across Europe has an average order value of EUR 65. Gross margin: 62% (EUR 40.30). The brand needs EUR 15 contribution per order after variable costs. That leaves EUR 25.30 for total affiliate cost. Maximum cost ratio: EUR 25.30 / EUR 65 = 0.389. Minimum ROAS: 1 / 0.389 = 2.6:1.
Same method, completely different target. This brand would be wrong to aim for 5:1 ROAS because it would cut publishers generating profitable orders at 3:1 or 4:1.
Getting Your Affiliate Programme Metrics Right
ROAS is a useful number. It belongs in your reporting. But building programme strategy around a single revenue-to-spend ratio ignores margins, ignores incrementality, ignores new customer value, and punishes the publishers that grow your brand long term. The teams that run the strongest programmes in European fintech and e-commerce measure ROAS alongside contribution margin, new customer share, and CAC, then make decisions based on the full picture.
If you are building or restructuring an affiliate programme and want support defining the right KPI framework for your business, Circlewise works with fintech and financial services brands across Europe to build programmes that optimise for actual profit, not vanity metrics.
Frequently Asked Questions
What Is a Good ROAS?
There is no universal answer. A “good” ROAS depends entirely on your gross margin. A SaaS product with 80% margins can be profitable at 2:1 ROAS, while a low-margin retail product might need 8:1 to break even. Work backwards from your own unit economics rather than benchmarking against an industry average that may use completely different cost definitions.
What Is the Difference Between ROAS and ROI?
ROAS measures gross revenue per unit of spend. ROI measures net profit after all costs. A programme with 10:1 ROAS can still have negative ROI if the product margin is thin enough. ROI is the more complete metric but requires more inputs to calculate. In practice, most affiliate teams track ROAS for speed and calculate ROI quarterly for strategic reviews.
How Do You Calculate ROAS in Affiliate Marketing?
Divide the revenue attributed to your affiliate channel by the total cost of the programme. The critical step is defining “total cost” correctly: include commissions, network override fees, tracking platform costs, bonuses, tenancy placements, and an allocation of programme management cost. Using commissions alone understates your true spend by 30-50%.
Is a Higher ROAS Always Better?
No. A higher ROAS often means the programme is too conservative. Cutting mid-performing publishers raises average ROAS but lowers total revenue and total profit. The goal is maximum profit at or above your minimum ROAS threshold, not maximum ROAS itself.
What Is a 4:1 ROAS?
A 4:1 ROAS means four euros of revenue for every one euro of spend, or 400%. Whether this is good depends on margins. For a business with 25% gross margin, 4:1 ROAS is roughly the break-even point. For a business with 50% margin, 4:1 represents a healthy return.
How Is ROAS Different from CPA?
ROAS is a ratio of revenue to spend. CPA is the cost per individual conversion. They answer different questions. ROAS tells you how efficiently a channel converts spend into revenue. CPA tells you how much each conversion costs. You need both. A low CPA with low average order value can produce poor ROAS. A high CPA on a high-value product can produce excellent ROAS.